
Check out our new US Political Future Index (UPFI), a comprehensive measure of anticipated Republican versus Democratic political control across major US electoral offices. Interested in learning more?
TL;DR:
- S&P has 55% odds of hitting 7,000 by year-end
- Stocks, Bitcoin, AND gold all hit records in October. This isn't normal.
- Global liquidity is creating an "everything rally" despite a prolonged federal government shutdown, a trade war between the world's largest superpowers, and wars in Europe and the Middle East
- Markets betting government uncertainty = more rate cuts = higher asset prices
- Seven stocks drive 55% of S&P gains since 2022—concentration worse than the dot-com bubble
- Is it time to take chips off the table?
📈 Market Snapshots
Stock Market
- S&P close price end of 2025? (Kalshi)
- Nasdaq-100 price end of 2025? (Kalshi)
- Will the S&P finish positive this year? (Kalshi)
- How high will the S&P get this year? (Kalshi)
- How low will the S&P get this year? (Kalshi)
GDP Growth
Bitcoin and Gold
- What price will Bitcoin hit in 2025? (Polymarket)
- How high will Bitcoin get this year? (Kalshi)
- What price will gold close at in 2025? (Polymarket)
- What price will gold close at in 2025? Higher Strikes (Polymarket)
Government Shutdown
- How many days will the federal government be shut down this year? (Kalshi)
- How many days will the federal government be shut down in 2025 (Polymarket)
- When will the Government shutdown end? (Polymarket)
🌎 Event Breakdown
What prediction markets reveal about the S&P's path to 7,000: As the S&P and Nasdaq continue to hit record highs, one has to wonder how long the party will last. They cannot go up forever, right?
What’s behind this historic rally? In short, AI.
The market’s strength can primarily be attributed to concentration in AI-related stocks. Just seven stocks—Alphabet, Amazon, Apple, Meta, Microsoft, Nvidia, and Tesla—have accounted for 55% of the S&P 500's gains since the end of 2022. This level of concentration is unprecedented and worse than the dot-com bubble.
Bank of America unveiled a recent survey showing that a record 54% of global fund managers believe we are in an AI stock bubble.
The counterargument to the AI bubble narrative is that AI is introducing real productivity gains, unlike the dot-com bubble. Companies will be able to do more with less, ultimately justifying the massive investments being made in HPC data centers.
Where do we go from here?
Today we’ll explore what’s next for the stock market. We’ll evaluate it against the backdrop of forecasted GDP growth. We’ll also try to understand the dynamics between gold and Bitcoin’s recent performance relative to the stock market; a bit of a followup to What are Gold and Bitcoin telling us?. Finally, we'll investigate how the federal government shutdown might impact market forecasts.
Let’s go.
The Stock Market is Showing No Signs of Slowing Down
In spite of the S&P and Nasdaq’s recent highs, prediction markets on Kalshi show no signs of slowing down.
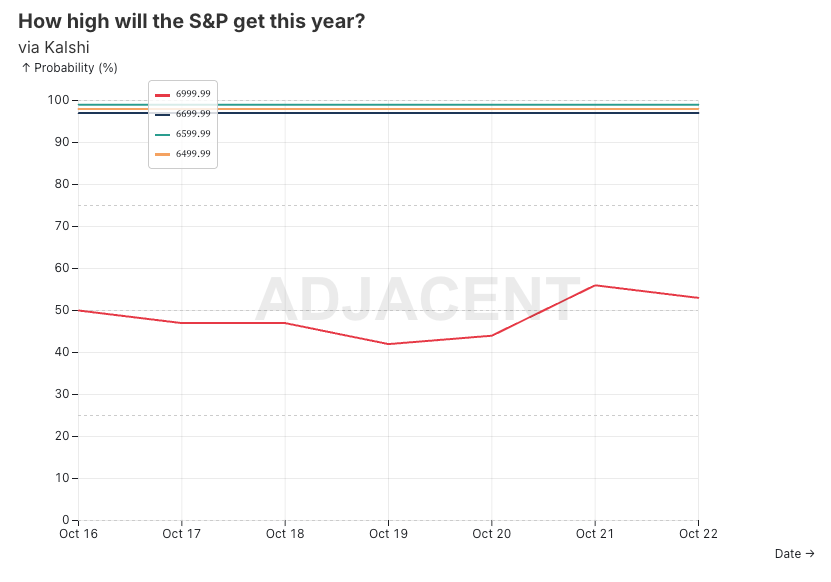
The S&P has been ranging between 6,750 and 6,550 over the last month. On Kalshi, we’ve seen a recent uptick in the probability of the S&P closing at all-time highs between 6800 and 7000 (29%).
The Nasdaq-100 also continues to hit all-time highs, ranging between 24,200 and 25,100+. Traders on Kalshi anticipate we’ll continue upward and close above 24,500 at the end of the year.
There’s unsurprisingly a high degree of likelihood the S&P will finish positive this year (93%).
The bullish sentiment doesn’t stop there. Since mid-August traders have been increasingly betting on the S&P reaching an all-time high of 6999.99 (55%) before year-end.
The projected floor is high too with there only being a 3% chance the S&P dips below 4,500 and 4% chance it dips below 4,000.
Consensus surrounding this bullish sentiment raises concerns for me personally. Especially as we’re in the heart of a trade war between the world’s two largest superpowers.
Why is everyone so bullish? Let’s dig deeper against the backdrop of forecasted GDP growth.
GDP Growth in 2025 vs S&P
We know the stock market is bullish based on AI-driven productivity gains and earnings growth. Is anticipated GDP growth a factor as well?
Since mid-September, Polymarket’s “GDP Growth in 2025” has seen a steady increase in the probability of growth ranging between 2.0% to 2.5% (66%). It has surpassed Kalshi’s 1.6% to 2.0% which had been leading the way, but now sits at 48%.
In short, prediction market traders increasingly believe the economy is getting stronger.
If we overlay the “How high will the S&P get in 2025” markets with GDP growth markets, we can see how as S&P forecasts get more bullish, so too do GDP growth forecasts.
Relationships between the stock market and GDP are nuanced and more complex than simple cause-and-effect. It is however interesting to see how GDP growth forecasts became more bullish after S&P forecasts became more bullish.
Now let’s investigate the relationship between the S&P and other asset classes like Bitcoin and gold.
S&P vs Gold and Bitcoin
Two weeks ago we dug into what new all-time highs in gold and Bitcoin were telling us. We concluded that gold and Bitcoin prices will continue to run if the US and other sovereigns are unable to introduce fiscal austerity (which we don’t anticipate happening any time soon or ever, frankly).
Let’s pause for a moment to internalize this. In the month of October (with one week left), Bitcoin AND gold AND the S&P AND the Nasdaq-100 have ALL hit all-time highs?
Umm, that’s just a tad unusual…
The current environment suggests that investors are hedging in the face of uncertainty. They’re investing both in safety (i.e., gold and perhaps Bitcoin) as well as growth potential in the AI trade.
There’s also unprecedented levels of liquidity in the market. Central banks around the world have been pumping money into the economy. Not to mention, the Fed has started an easing cycle last month, and is about to cease quantitative tightening.
It raises the question, is there a relationship between how prediction markets are trading year-end growth across the S&P, Bitcoin, and gold?
We can see how in early October bullish S&P sentiment closely mirrored bullish Bitcoin sentiment. However, over 2-3 days we can see them diverging a bit.
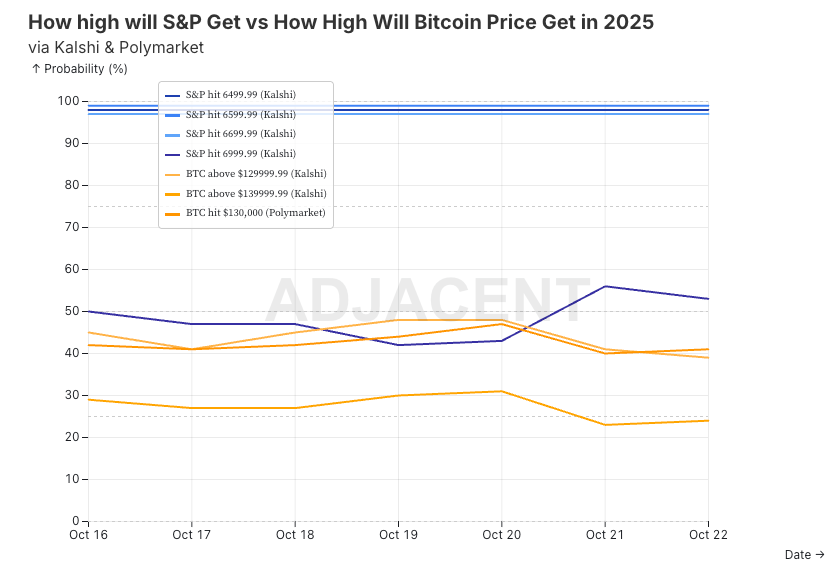
When it comes to S&P vs gold bullishness, we see a similar relationship.
Similar to the S&P vs Bitcoin prediction market forecasts, we have begun to see more divergence over the last few days following Trump’s 100% tariff threats on China.
One would think this uniform bullishness across varied assets like equities, Gold, and Bitcoin must soon lose momentum, right?
Well, prediction market traders appear to be betting on more liquidity coming which will further buoy these elevated price levels.
This bullishness does raise questions, though. Especially in the face of a trade war and a prolonged US federal government shutdown.
What about the Government Shutdown?
We are now 3+ weeks into the second-longest shutdown in US history. Republicans and Democrats remain in a stalemate, unable to advance a House-passed funding bill that would have extended funding until November 21st.
The shutdown has resulted in the furlough of 900,000 federal employees and another 2 million working without pay.
Historically, shutdowns have had limited impact on the stock market. They can cause short-term volatility, but markets often see through the political noise.
That said, according to Polymarket and Kalshi, it doesn’t appear this shutdown will end any time soon.
It is interesting to see how over the last 2 days as the likelihood of the shutdown continuing increases, so too did the probability of the S&P reaching an all-time high of 7000.
I have a few thoughts on this potential relationship.
First, a prolonged shutdown - which weakens economic data, delays jobs data reporting, creates uncertainty and slows hiring and spending - might lead the Fed to get more aggressive with rate cuts. In other words, “bad news is good news”.
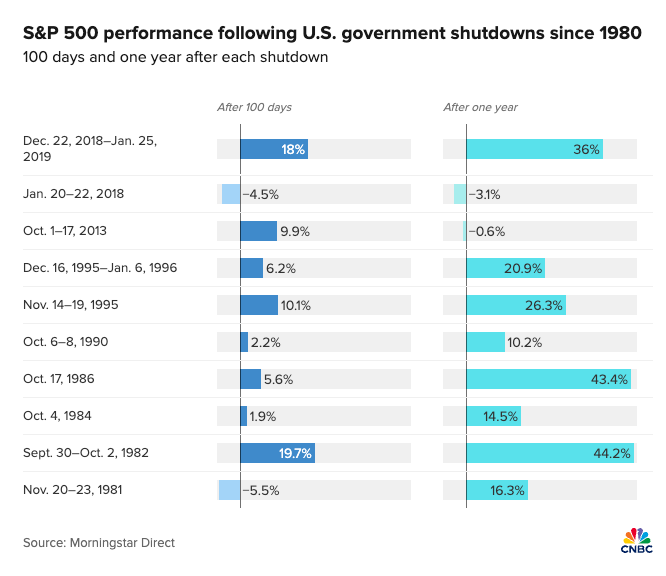
Next, after the 2018-2019 shutdown, the S&P rose 18% 100 days later, and 36% after one year.
Traders might be betting on a repeat performance, especially since this shutdown, like the last, is occurring during a period of Fed policy uncertainty.
Another consideration traders may be weighing is political gridlock. It seems at the moment that neither party will blink. This in turn means major policy changes are unlikely, eliminating some uncertainty.
All of that said, it is also very possible there is no causal relationship at all. The stock market has been ripping for months with a lot of momentum. Traders may believe this momentum is too strong and that a prolonged shutdown will have little effect.
Let’s tie it altogether.
What’s Next for the Stock Market?
We are living in a historic time of economic uncertainty. The stock market hates uncertainty, but here we are hitting new all-time highs after new all-time highs.
The bull case for the S&P and Nasdaq remains strong. Markets across Polymarket and Kalshi see a 55% chance of the S&P reaching 7,000 by year-end and 93% chance of finishing positive. Much of this bullishness stems from AI-driven productivity gains and anticipated Fed rate cuts.
The parallel bullishness in GDP forecasts (66% chance of 2.0% - 2.5% growth) also suggests optimism and genuine belief in economic resilience.
What is particularly unusual is the simultaneous all-time highs across the S&P, Nasdaq-100, Bitcoin and especially gold. This isn’t normal. It suggests we’re in an environment of excess liquidity which is elevating all asset classes.
The Fed easing and soon ending quantitative tightening is creating conditions that enable traders and investors alike to comfortably bid up both risk assets and safe haven assets.
It’s curious to see markets thriving despite the ongoing government shutdown and the trade tensions between the US and China. Prediction markets seem to reflect these are actually catalysts for further Fed easing. Not to mention the strong performance of the stock market following the 2018-2019 shutdown may too be driving the bullishness.
From my perspective, this consensus bullishness may be a warning. I believe the risk of a sharp reversal is increasing given the unique environment we find ourselves in. Markets are shrugging off the second-longest federal government shutdown in history, a historic trade war with China, and wars in Ukraine and the Middle East
Will Fed policy easing and AI-driven productivity deliver a goldilocks scenario for the stock market in the face of all of this uncertainty?
That sure seems like a lot of things need to go right. Might be time to take some chips off the table.
Related markets & forecasts:
- S&P price today at 4pm EDT?
- S&P price range on Friday at 4pm EDT?
- US GDP growth in Q3 2025?
- 5% GDP contraction in Q3 2025?
- Negative GDP growth in 2025?
- Who will vote for the next government funding bill in the Senate?
- Who will vote for the next government funding bill in the House?
- Will the next government funding bill be a 'clean CR'?
❓Questions we asked
Follow the Adjacent community on Metaculus here!
- Will China and the EU Reach a Trade or Tariff Agreement in 2025?
- What will the highest level of Bitcoin dominance be in 2025?
- Will the U.S. Treasury Issue BitBonds by December 31, 2028?
- Which of the following California oil refineries will first announce the intent to idle, restructure, or cease operations before 2028?
Follow us on X @AdjacentNews for real-time market takes. Explore adj.news for the full scoop, or tap our API to crunch the data yourself.